

In this article we will show you how to design the tableau dashboard using multiple data connections based on csv files.
We are going to design the dashboard using the Brazillian ECommerce public dataset available in Kaggle. You can download the dataset using the link.
We can see that there are 9 different datasets like Orders, Order_Items, Order_Reviews, Order_Payments, Order_Sellers, Customers, Products, Geo_Locations and Product_Category_Translation.
Lets look into the tables/columns to understand the relationship between the tables.
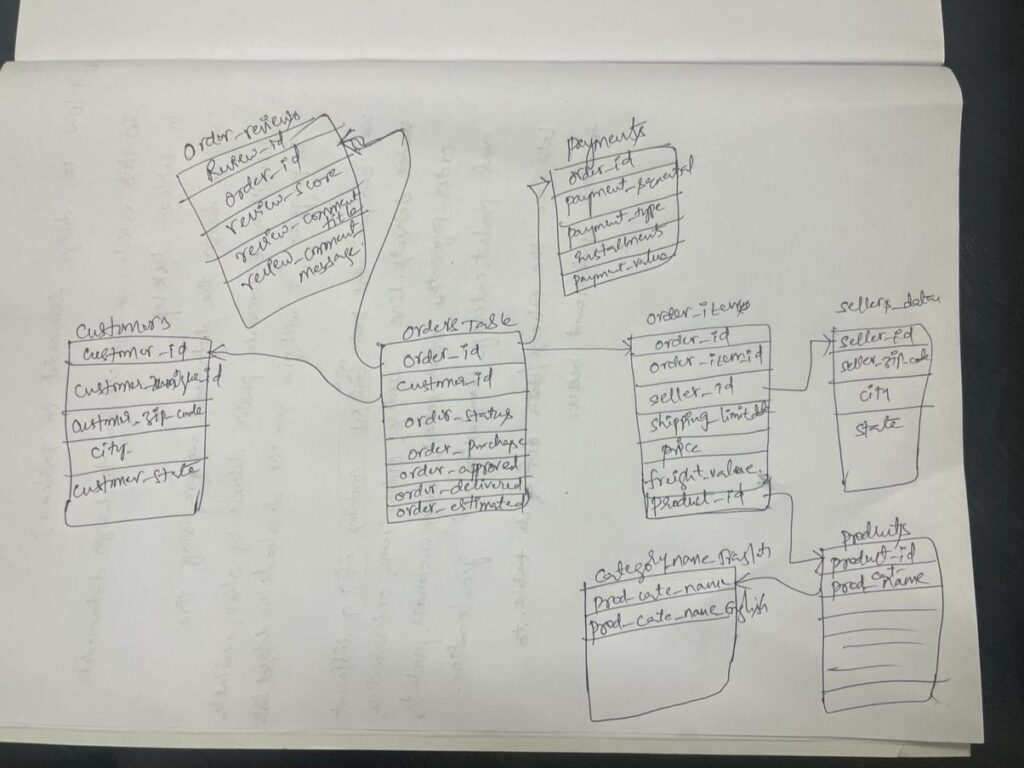
We can see that,
- Orders Table/dataset has key relationship with tables Order_Items, Payments, Order_Reviews using Order_Id column.
- Orders Table/dataset has key relationship with table Customers using Customer_Id Column.
- Order_Items table has key relationship with table Sellers_dataset using Seller_Id column.
- Order_Items table has key relationship with table Products using Product_Id column.
- Products table has key relationship with Category_Name_Translation using Prod_Category_Name column.
Upload all the datasets as multiple connections using Add option next to Connections in the below screenshot and drag and drop the datasets to setup the relationship between the tables.
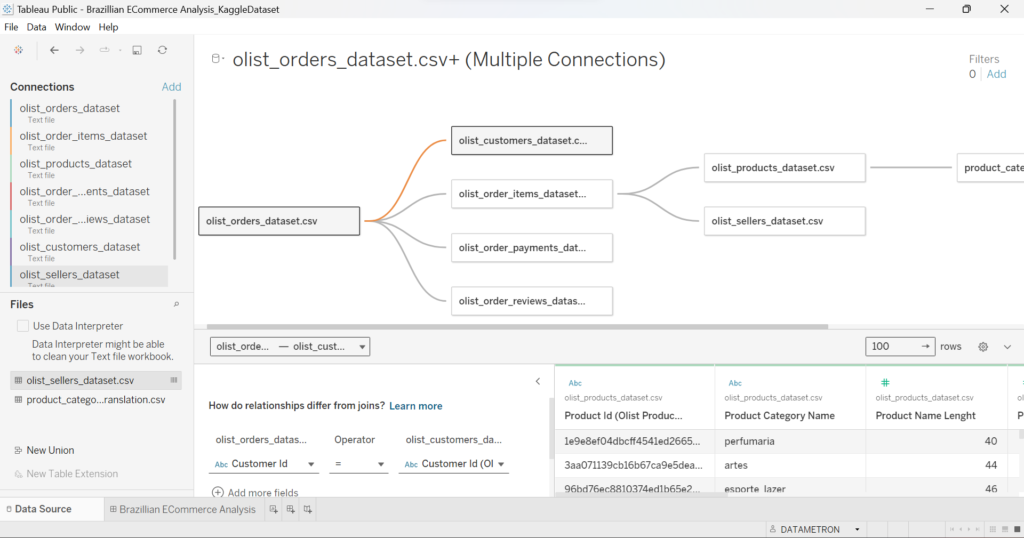
Once all the datasets are related, datasource model looks like above screen.
Once the datamodel is ready, we can start designing sheets as per our requirements.
We have designed the dashboard using couple of sheets and the dashboard image is as below.
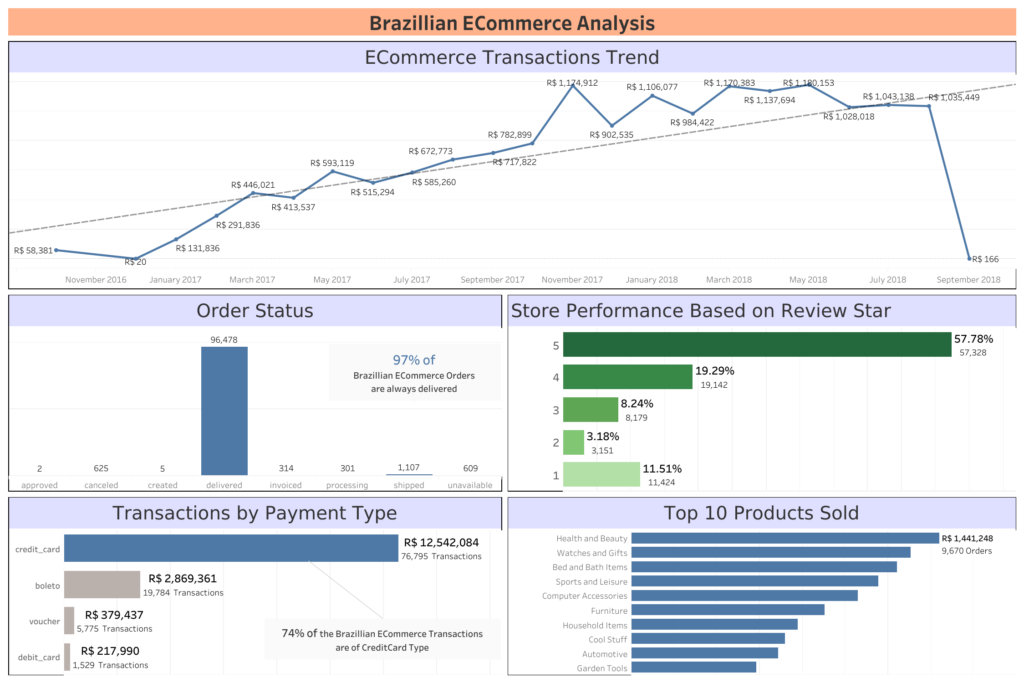
You can access the dashboard using the below link.